How to add Dynamic Groups to a Dashboard | v8+

Within Certero version 8 there is a feature that allows users to add Data Groups to dashboards.
This function will open up unlimited dashboards based on data that can be queried within the Certero Data grids .
Creating a Dynamic Group
Add Data Groups to Dashboards
Creating a Dynamic Group
Dynamic groups are a very flexible way of mining the wealth of inventory data within Certero.
Use the example below to create a Dynamic Group in Certero to search, in this case, for machines that don't have a specific Windows hotfix applied. The Dynamic Group makes use of a simple feature to only return those computers that do not meet the specified criteria.
Create the Dynamic Group
Go to Data Groups > Dynamic Groups and click the New button.
You will see on the Details tab you can give the Dynamic Group a ' Name' and 'Description'.
Select the 'Data Type' that you are interested in, in this case Windows Clients as we're looking for Windows machines without a specific hotfix update.
Next, select the Criteria tab and the Query Builder section will be shown.
Ensure the Data Query tab is visible and you can see the ' Table', 'Field', Operator and 'Value' attributes.
Attribute | Setting |
Table | Windows Updates |
Field | Hotfix ID - String |
Operator | = |
Value | Enter the name of the hotfix of interest, for example KB4012606 |
Ensure the Return records that do not match the criteria that is selected.
At this point, your screen will look something like the example below.

Click the “Preview” button if you wish to see some example computers the Dynamic Group will return.
Click “Save” when done and your Dynamic Group is ready for use.
Add Data Groups to Dashboards
You can now add any previously created Data Groups you have created directly to a dashboards chart. This allows you to chart multiple custom data groups in a visual manner.
1. Navigate to your chosen Certero Dashboard

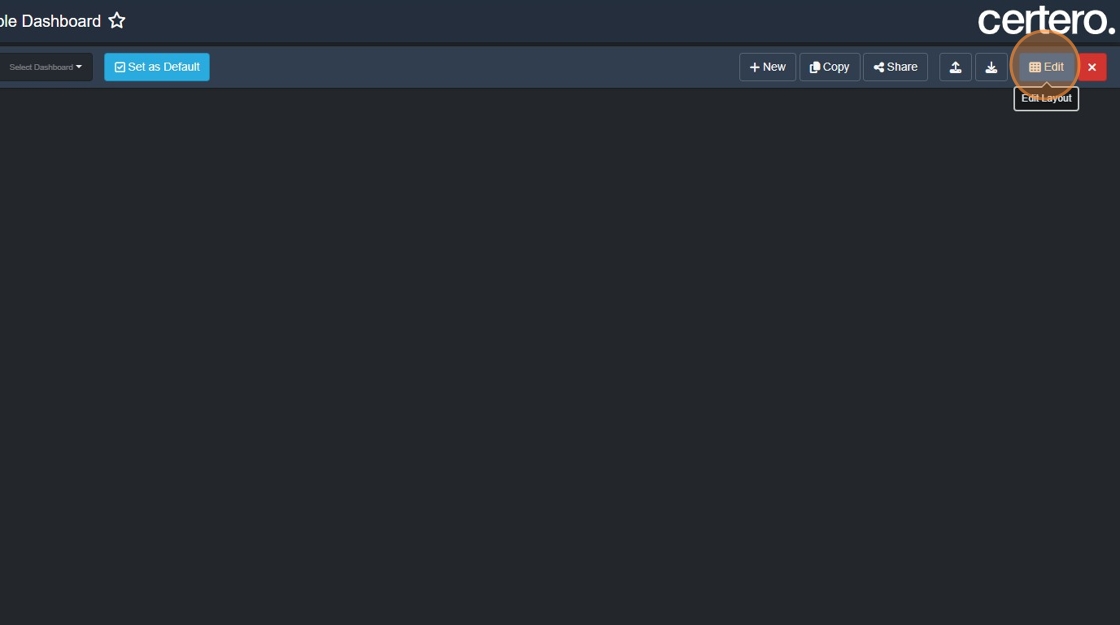
2. Click "Edit"
3. Click + (Add new item).

4. Click "Chart (New)"

5. Click "Computer Systems"

6. Click "Microsoft Windows"

7. Click "OK", a default chart with data will be created.
The next step is to edit this chart and change the data and visual elements.

8. Click “Edit”.

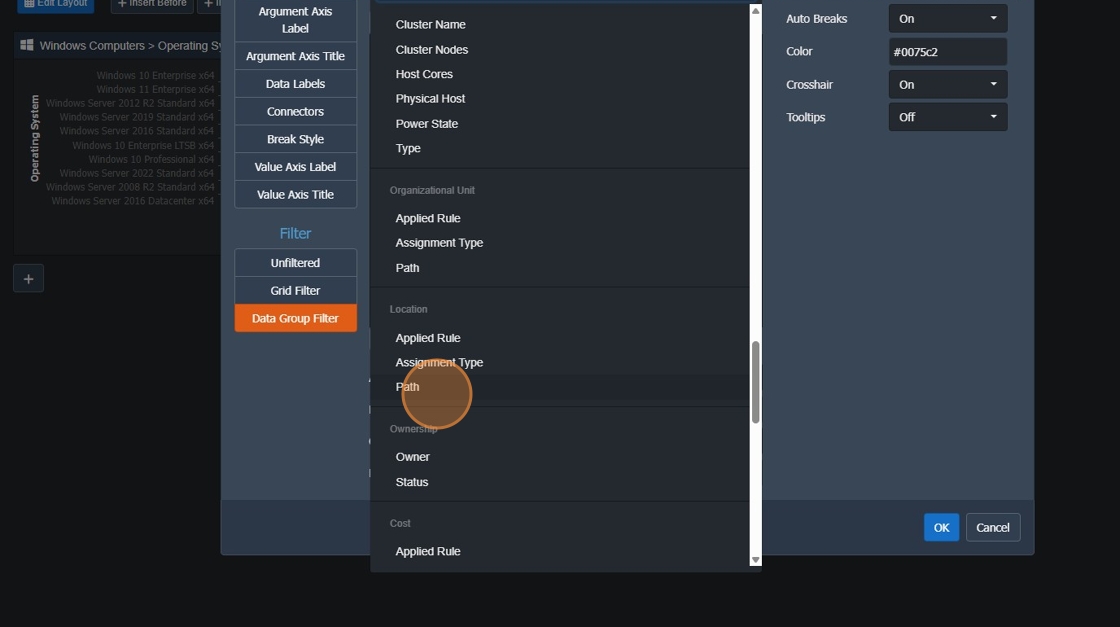
9. Click "Data Group Filter"

10. Click your created Dynamic Group.
Note: You can only select a matching data type at this stage.

11. Click "OK"

12. Drop down the Grouping Field and select what type of data you would like to display in the chart:
14. Click "Aggregate"
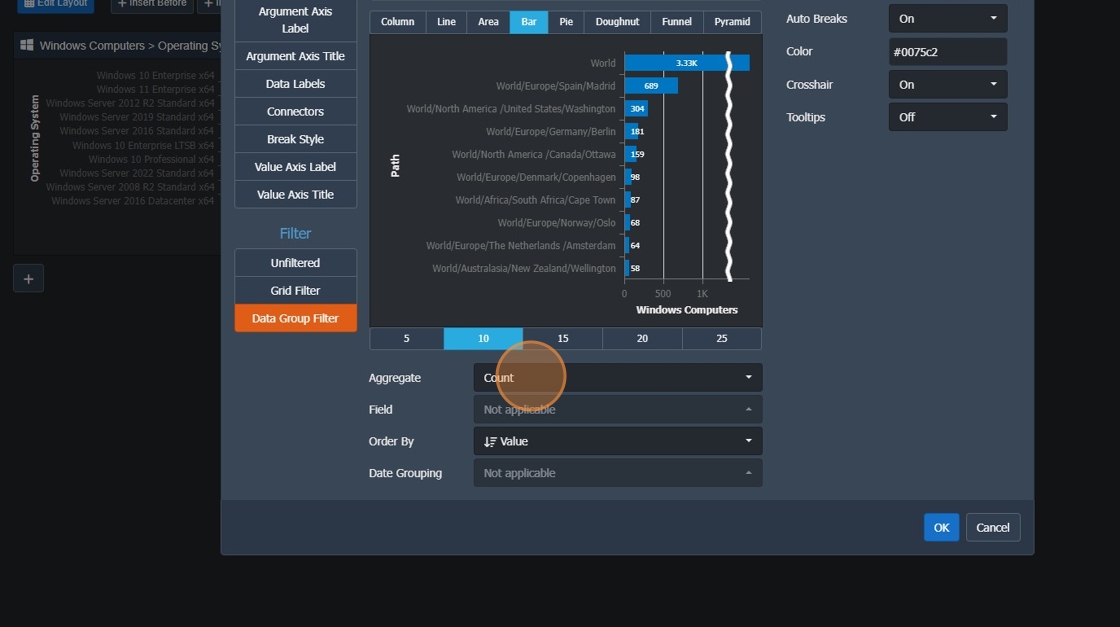
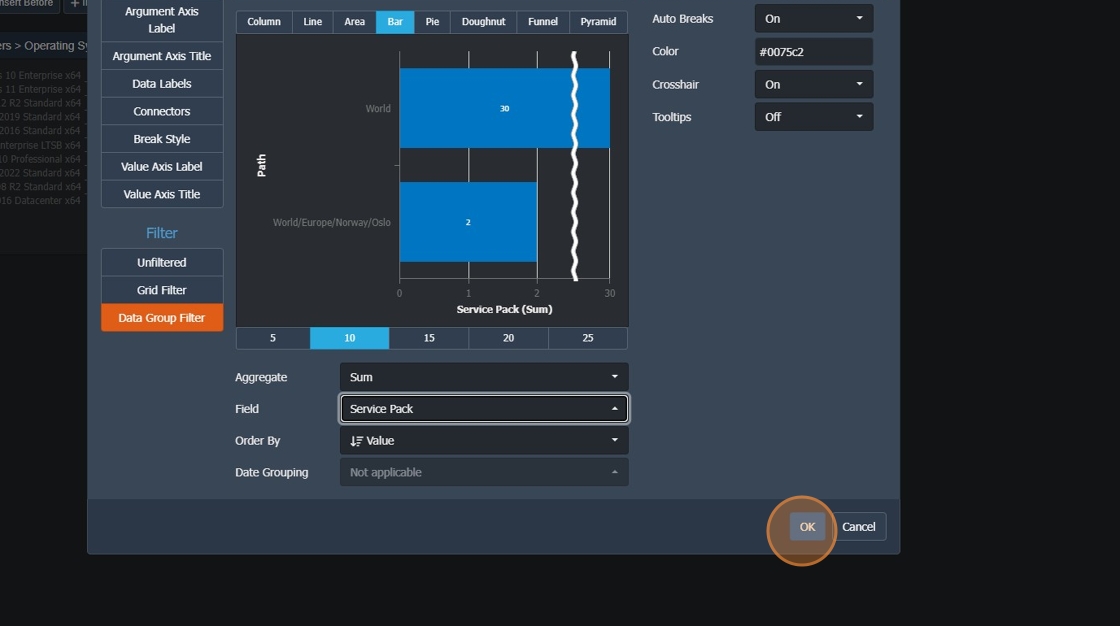
15. Select "Sum"

16. Change your “Field” to your desired data type

19. Click "OK"
22. Click “Rename” to set a name for your chart.

27. Type "Windows - No Patches in 90 days"

28. Click "OK"

29. Click "Save" to commit your changes.
