How to add a Chart to a Dashboard

Example - Create Microsoft 365 User chart
45. Click "Insert After"

46. Click here.

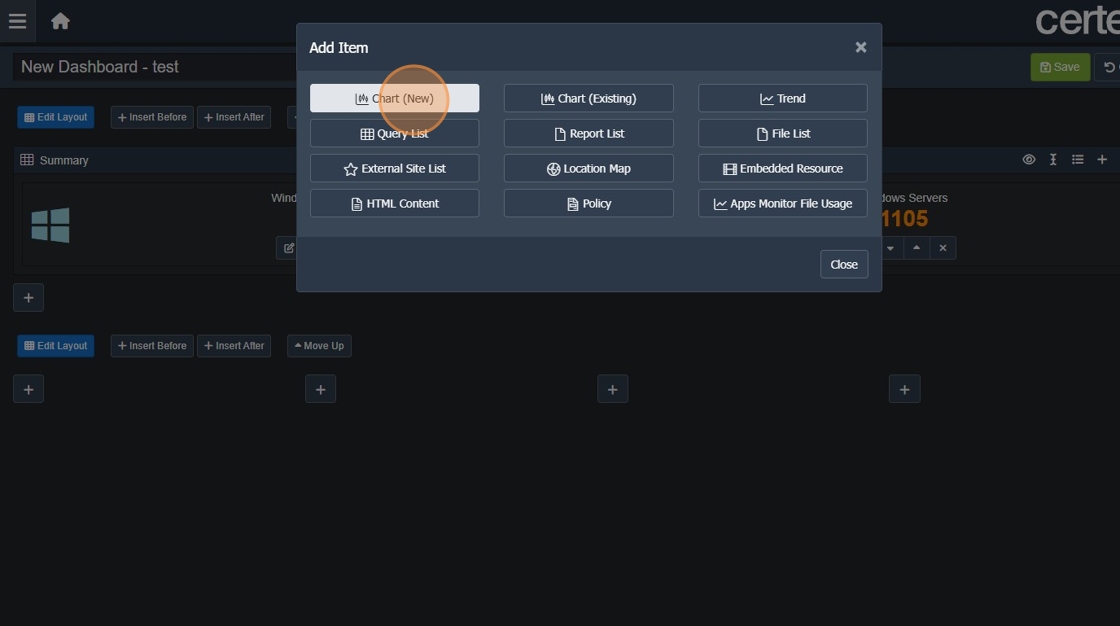
47. Click this button.

48. Click "Chart (New)"
49. Click "Microsoft 365"

50. Click "Users"
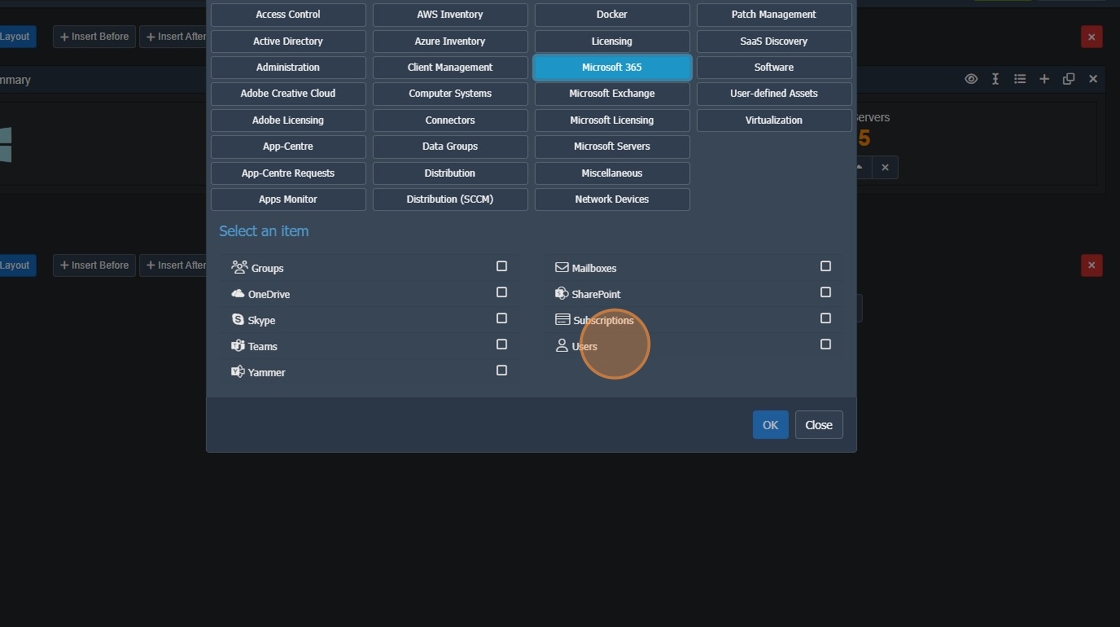
51. Click "OK"

52. Click here.

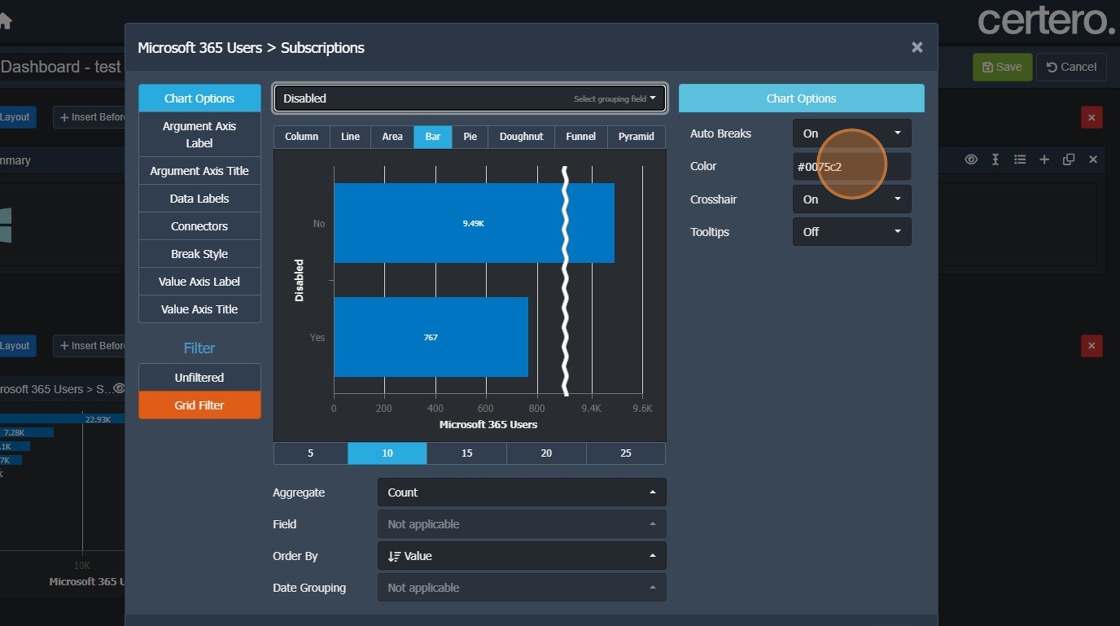
53. Click "Grid Filter"

54. Click "Show filter options for column 'Disabled'"

55. Click "Show filter options for column 'Disabled'"

56. Click "Subscription"

57. Click this text field.

58. Type "e3"
59. Click this text field.

60. Type "Microsoft 365 e3 [[Enter]]"
61. Click "Apply"

62. Click "Subscriptions"

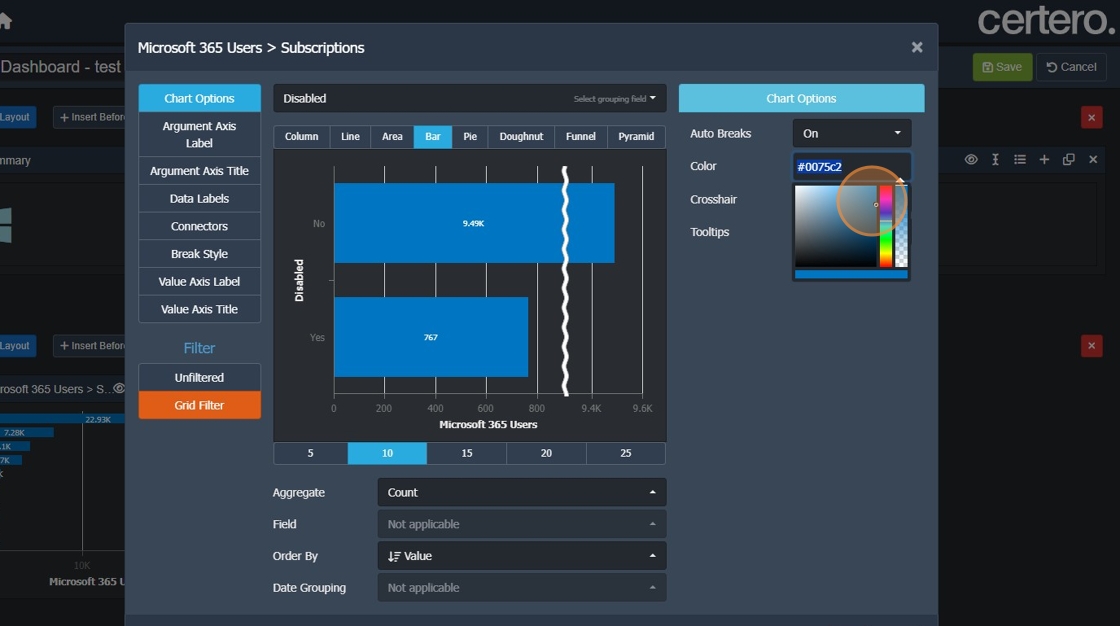
63. Click "Disabled"

64. Click this text field.
65. Click here.
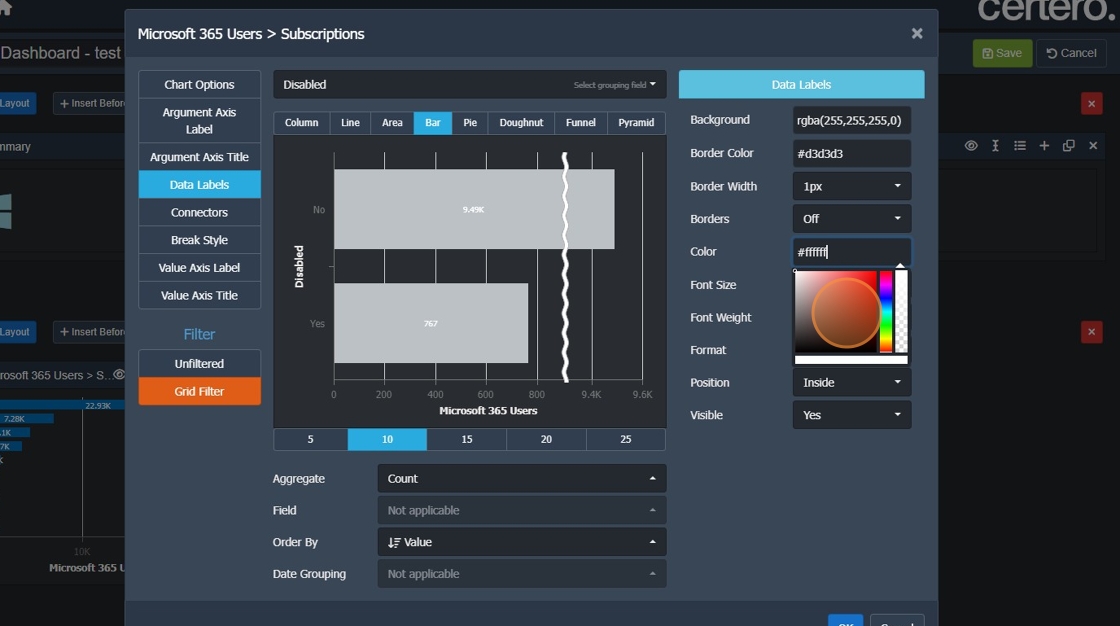
66. Click "Data Labels"

67. Click this text field.

68. Click here.
69. Click "OK"

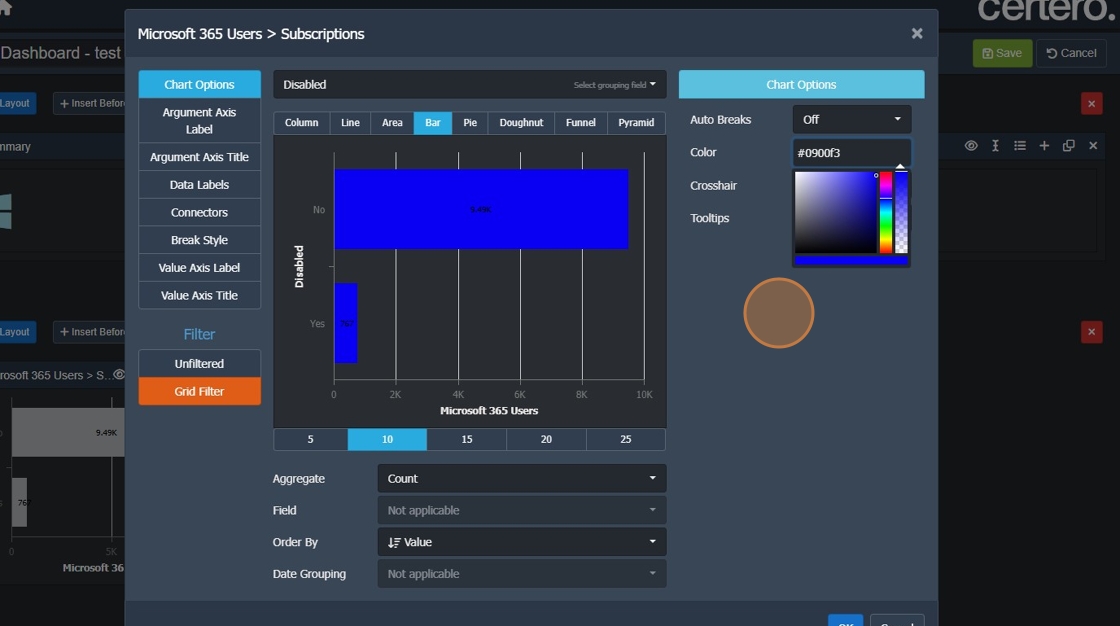
70. Click here.

71. Click "On"

72. Click "Off"

73. Click "OK"

74. Click here.

75. Click this text field.

76. Click here.

77. Click here.

78. Click "Chart Options Auto Breaks Off On Off Color Crosshair Off On On Tooltips Off On Off"
79. Click "Data Labels"

80. Click this text field.

81. Click here.

82. Click here.

83. Click "Chart Options"

84. Click this text field.

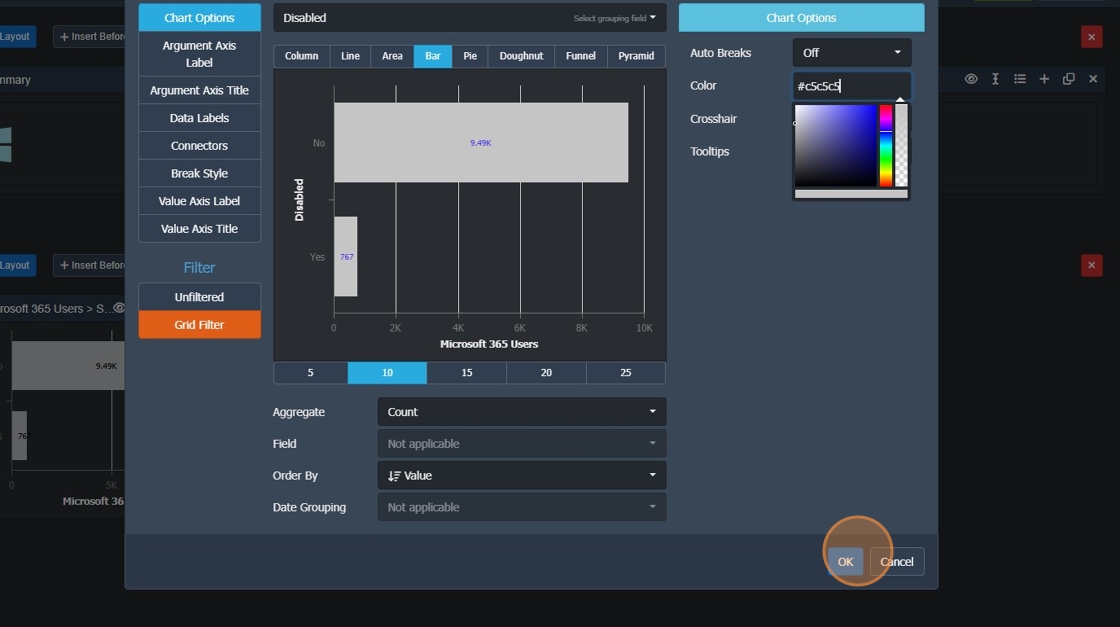
85. Click here.

86. Click "OK"
87. Click this button.

88. Click "Add Item Chart (New) Chart (Existing) Trend Query List Report List File List External Site List Location Map Embedded Resource HTML Content Poli..."

89. Click "Close"

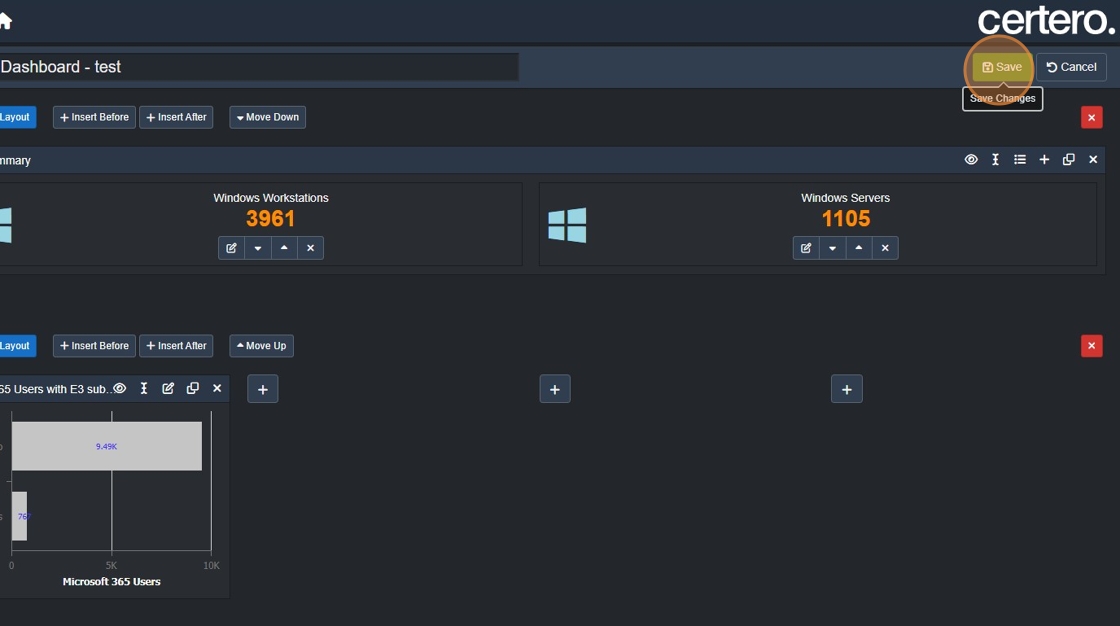
90. Click here.

91. Type "M365 Users with E3 subscriptions by status"
92. Click "OK"

93. Click "Save"